ELEMENTS AND CONTENTS OF THE CARDS
Each card contains distinctive elements that appear in different quantities and arrangements in each model. These include volumes with residential and service functions in the form of cuboids with a base size of 7x8m and a height of 3.20m in white and orange, respectively.
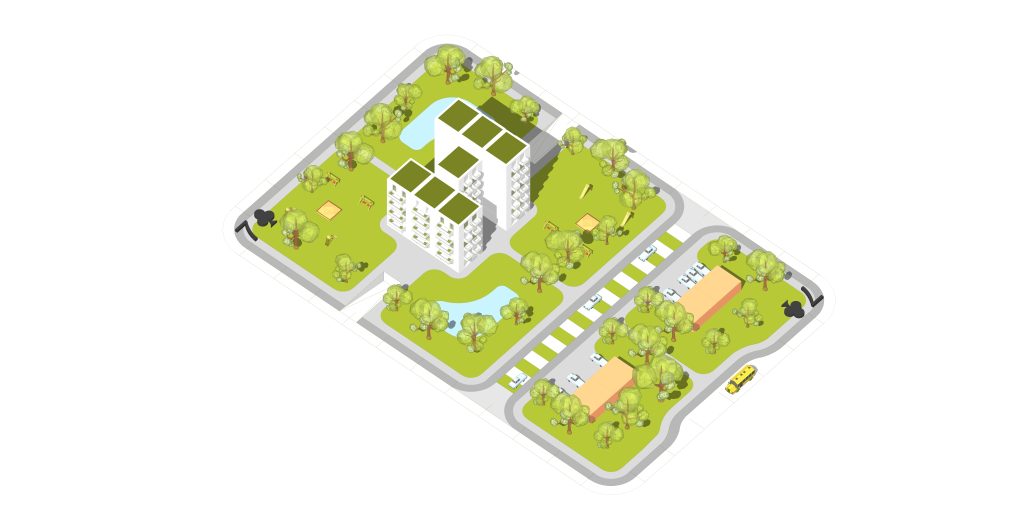
On the periphery of individual quarters (charters), elements with a public transportation function have been proposed, namely bus stops with bays and bicycle parking stations. The cards also include biologically active areas in the form of green-colored planes, and trees and shrubs as translucent green solids. Different types of areas designated for communication are also distinguished, roads (white color), pedestrian and roadways (gray-green striping), pedestrian routes (light gray color) and bicycle routes (dark gray color) appear, and exits to underground parking facilities are also marked.
Purple boxes mark playgrounds. The charters were designed as plots of about 1 hectare with dimensions of 120x80m, which can be considered a model size for the quarter. The field designated for residential development is in the form of a square with dimensions of 80x80m.
The rest of the plot has been designed as a space for infrastructure related to the color of the card and, at the same time, a virtual manager of the area
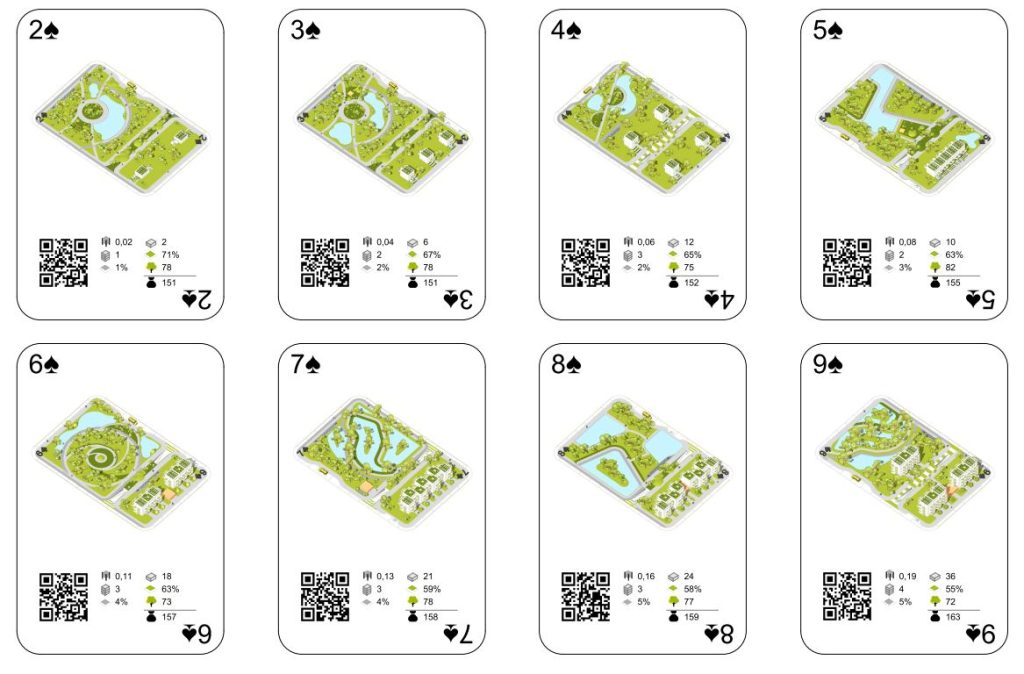
Charters 2 through 10 represent residential development layouts in a cumulative manner: the higher the charter value, the higher the development intensity (number of housing units per hectare). The lowest values are mapped as single-family, low- and medium-intensity multi-family development. Assumptions for the increase in the number of floors and the intensity of development with the differentiation of urban form.
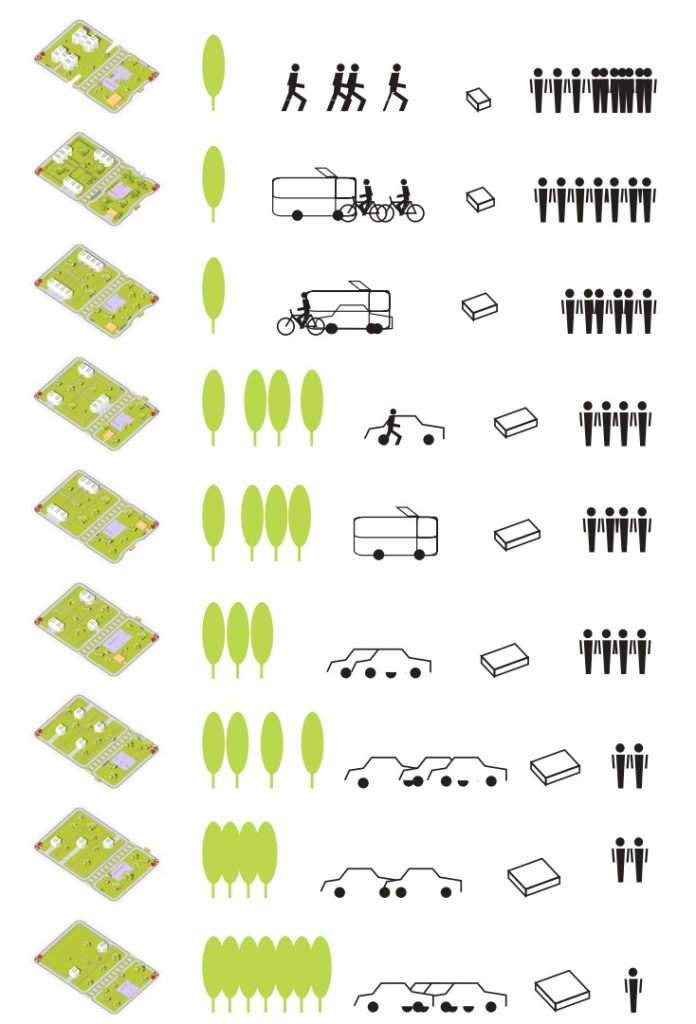
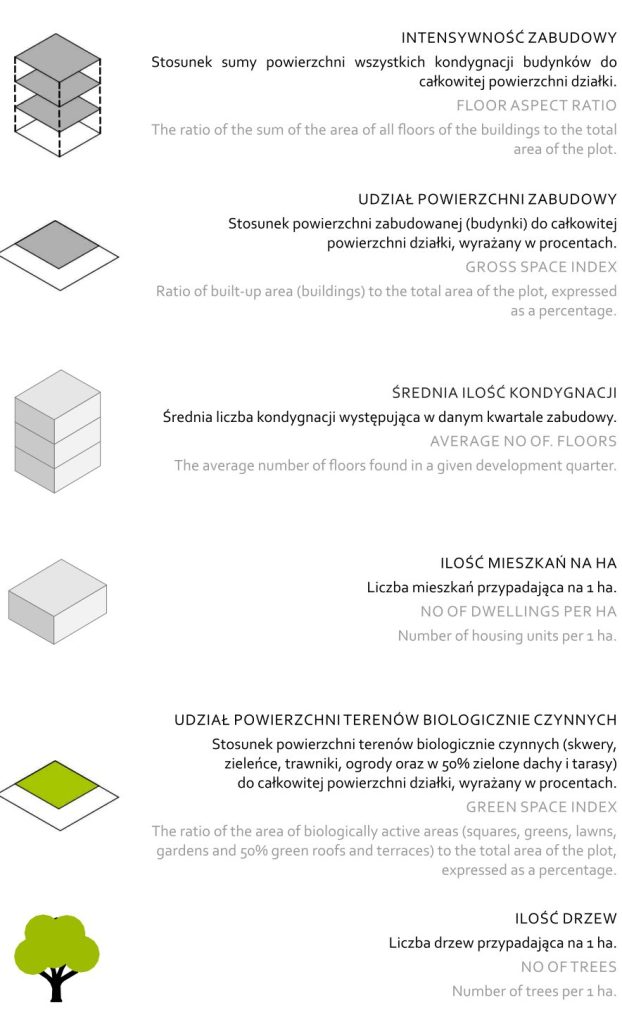
Six urban indicators and parameters were distinguished for each development model, which were then summarized in tables. As the intensity of development increases, the parameter of the number of stories and the building area ratio increases, while the proportion of biologically active area and the number of trees decreases. For each
of the colors and fi gures of the cards, the values of indicators and parameters remain characteristic.
Building intensity
Share of built-up area
Average number of floors
Number of apartments per ha
Share of area of biolo-
biologically active areas
Number of trees
For the selected games, a point sum of indicators and parameters was proposed: the number of dwellings per ha, the share of area of biologically active areas and the number of trees. The authors considered that these are the indicators that best illustrate the relationship between development intensity
and greenery.